AYIT Part 4: An overview of Infant Mortality in England and Wales: 1870-1910
With thanks to Chris Galley for taking the time to answer my questions.
Infant Mortality Rate (IMR) — the number of infant deaths under the age of one per thousand births — is a useful indicator of both the health of a population and of its supporting health infrastructure and welfare (discussed in brief in parts 2 and 3). However, it is only an indicator, and indicators are worthless without context. As an example, I highlight a particularly bad use of statistics and the IMR. The following (Figure 1) was printed in The Great War and the British People (1987) by the historian Jay Winter.
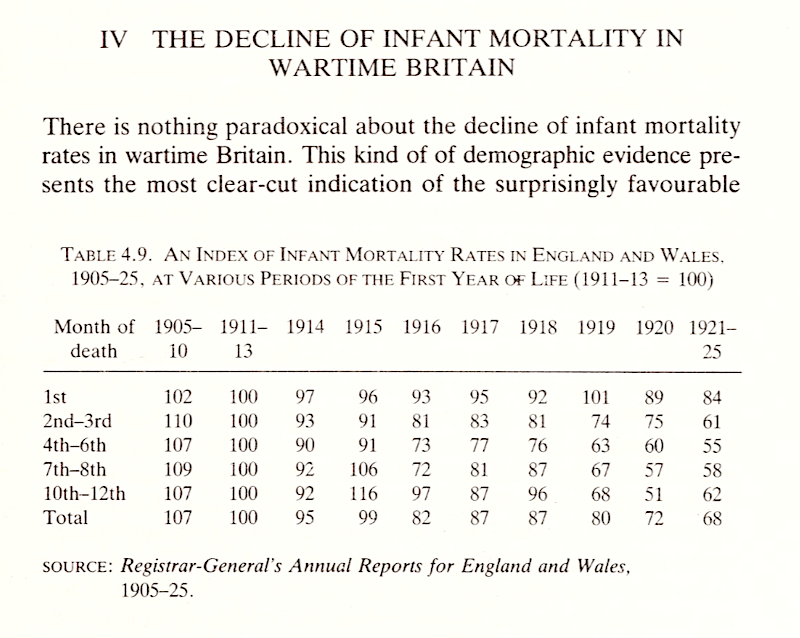
The table shows that between the years 1914 and 1920, IMR dropped by 23 index points from 95 to 72.1 In the conclusion to the chapter, Winter writes: 'the period effects point in one direction: towards environmental improvements during the war yielding increasing survival chances not only for young children and mothers but also for the bulk of the civilian population'.2 In the overall conclusion, he further writes: 'Infant maternal mortality rates declined sharply during the war' — noting how gains were especially made in overcrowded urban areas where the labour force lived.3
The problem with that assumption is as follows: Figure 2 below, which shows the infant mortality rate by year from 1851 to 1951 (the black line shows actuals, and the blue line shows the trend) quite clearly shows that it was already in a 'sharply decline' from the start of the century. I will be returning to Jay Winters' comments in the summary of this article, but as R. Millward and F. Bell wrote in a 2001 paper on IMR, 'Any conclusions, such as urban environments were the cause of higher rates of IMR, should be treated with care as though there might be a statistical relationship, the numbers actually shed little light on causation'.4 Referring to our cohort, those born between 5 August 1888 and 4 August 1889, and the basis of these articles, one in seven would die in their first year (160,000), and given the importance of the health of the nation to the First World War narrative, this article provides an overview of causation.
Before diving in, as this is a complicated topic and there is a lot to cover, having established in the previous articles that a one-size-fits-all answer is unsatisfactory to cover the entire United Kingdom, for the purpose of brevity, this article uses numbers and cases from England and Wales. Likewise, having discussed contemporary accounts in previous articles, this article focuses on modern analysis.
The Numbers
As with maternal mortality, there are data issues to consider — most notably, the number of births is likely to be underreported and, as a result, the IMR understated.5 Like maternal mortality, numbers were massaged by the profession and institutions to present a more favourable picture; Gloucester Council for example, in their medical officer report of 1889, gave their infant mortality rate as per thousand of population, not the standard per thousand births — thus they presented a figure of 3.4 per thousand rather than an actual figure of 130 per thousand — the difference is plain to see.6
There is then the matter of still-births; until 1927 it was not legally required to register still-births and there is evidence that a number of infants who died shortly after birth were treated as still-born.7 One explanation for doing so was economic in nature:
In 1893 St Pancras Burial Board charged 7 shillings and 8 pence for burying a live-born as against 2 shillings and sixpence for a stillborn, and by paying an undertaker to stuff a still-born secretly inside a coffin with an adult, the cemetery fees could be avoided altogether. Still-borns were dumped in exposed places and not unusually, and quite legally buried in people's own back gardens to avoid burial costs. If a baby lived for a few hours, it was still casually treated as a still born... This practice continued into the twentieth century.8
Another consideration is confusion: considering that society was more locally focused at the time, and in relation to the discussion in the earlier article on midwifery, there was a level of ignorance about the correct process when it came to registering infant deaths. There are numerous newspaper articles to this effect, where a midwife, not realising the need to record a death if the baby lived a short time, found herself in court — such as in Sheffield in February 1885 and Portsmouth in September 1888. There was also, depending on location, confusion about whether a certificate issued by a midwife was considered sufficient proof.9 This dubiousness over the process — by all involved — also presents another challenge with numbers from local parishes not reconciling with the national Registrar General figures. In addition, this was a period which saw the introduction of Local Medical Officers for Health (MOH), with the first being appointed in Liverpool 1867 and the last in Northern Ireland in 1948, completing the coverage of the UK.10 Thus, at the time, from a reporting perspective, there were some areas, such as Liverpool, Sheffield, and Birmingham, with extremely detailed information, and others with much less. The steady roll out of MOHs also played another role in building our picture, as discussed below.
The Chart
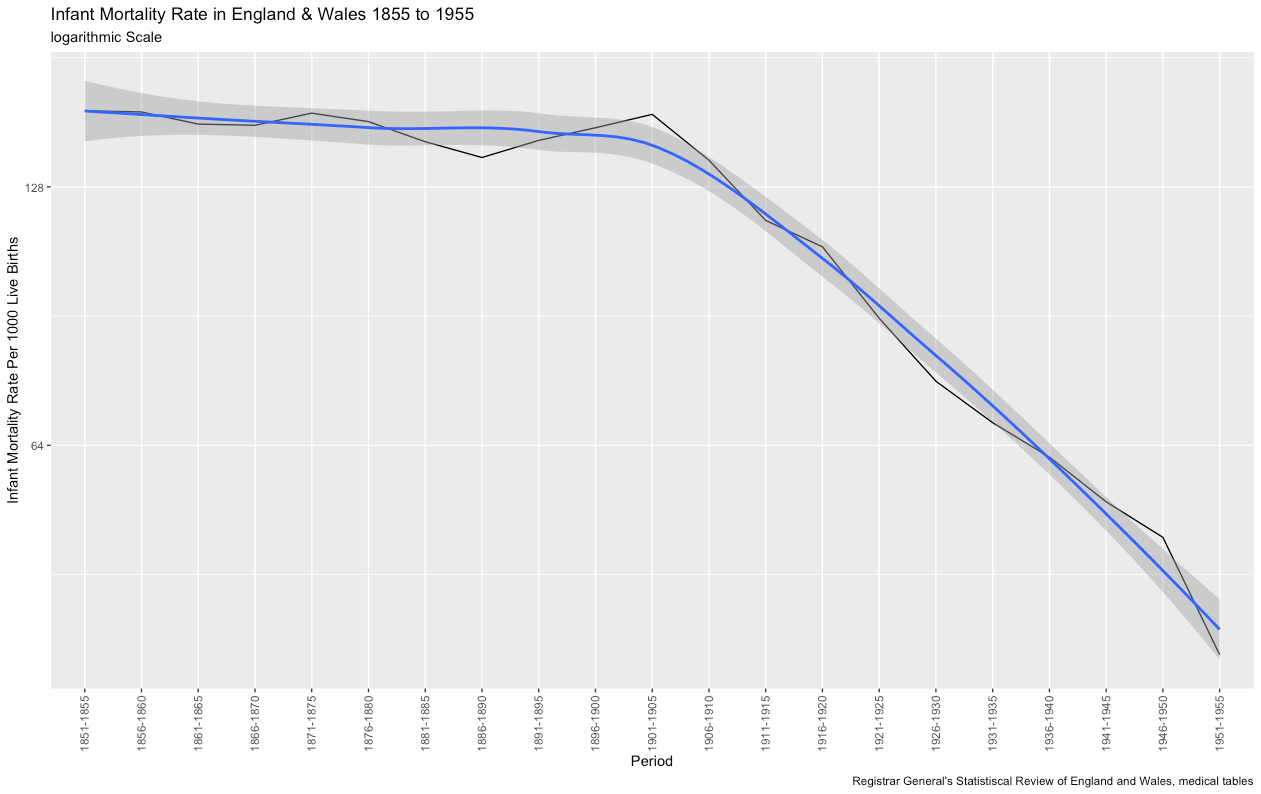
I want to first present the data in the same way as I did with Maternal Mortality rates in part 3 to allow for a comparison. I have used a logarithmic scale to highlight the trend, which shows there was a slow decline in the nineteenth century, but at the start of the twentieth century, it started to build momentum and was then onto a firm downward protectory.11 As of 2022, the rate in the United Kingdom is just 3.422 per a thousand births.12 This contrasts with the MMR rate which does not start to drop until the 1930s — which was the time when sulphonates, an antibiotic, were introduced.13 While both numbers decline over this timespan, that is where the correlation stops, and that low correlation should be the first clue that simple factors, such as urban environments, are not the sole reason to explain such rates.
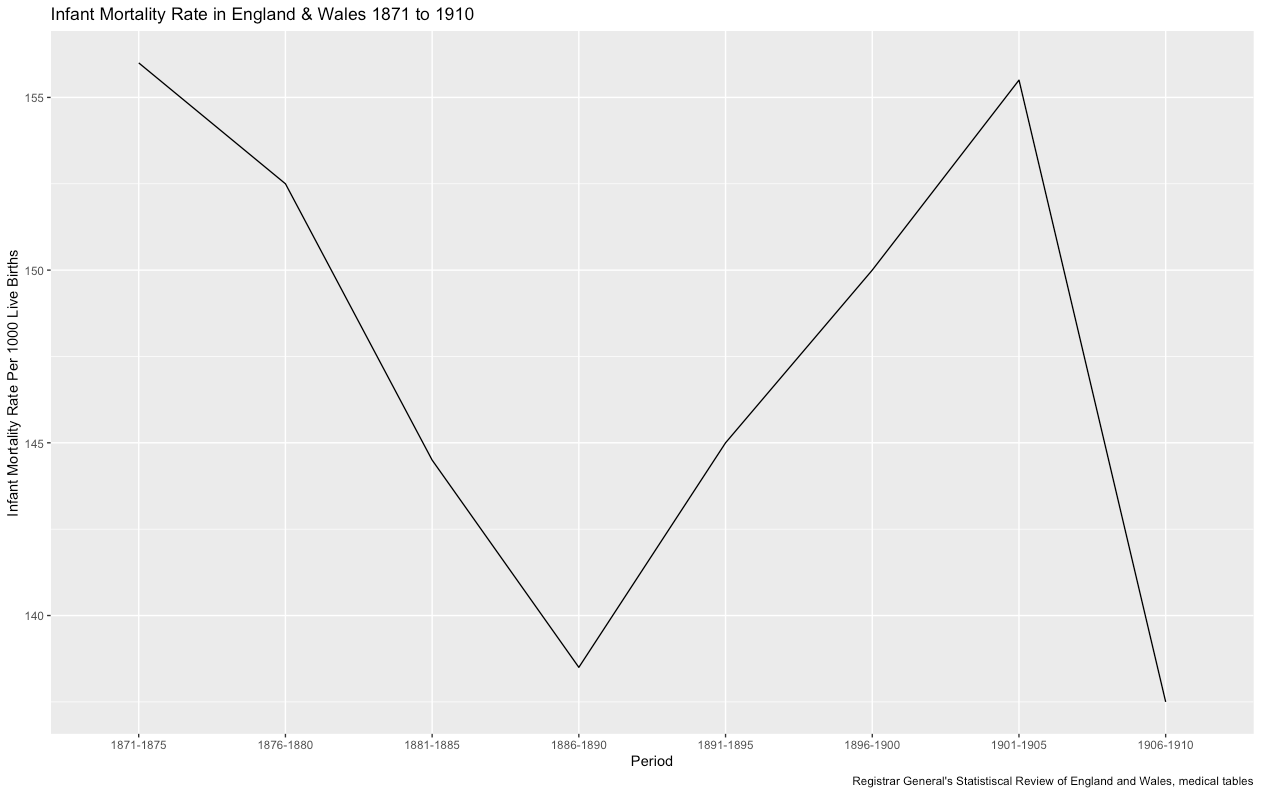
If we now remove the smoothing and focus on the period in question, we get the following chart and this interesting backwards 'N' shape (Figure 3). Our cohort was born at the bottom of the 'V' shape which means for some mothers, they were about go through childbirth in a period where the IMR rate was the lowest it had been for twenty years, having dropped from 156 per thousand in 1870 to just 138.5 — which must have bought some comfort, but for others, they were about to give birth in a time of an alarming rise in the rates, on a trajectory that would take it back up to 155.5 by 1900. Which leads one to wonder what was going on.
To answer this question, we are first going to consider the driving factors behind the decline and then look at the backwards 'N' anomaly.
The Decline
Respiratory Diseases
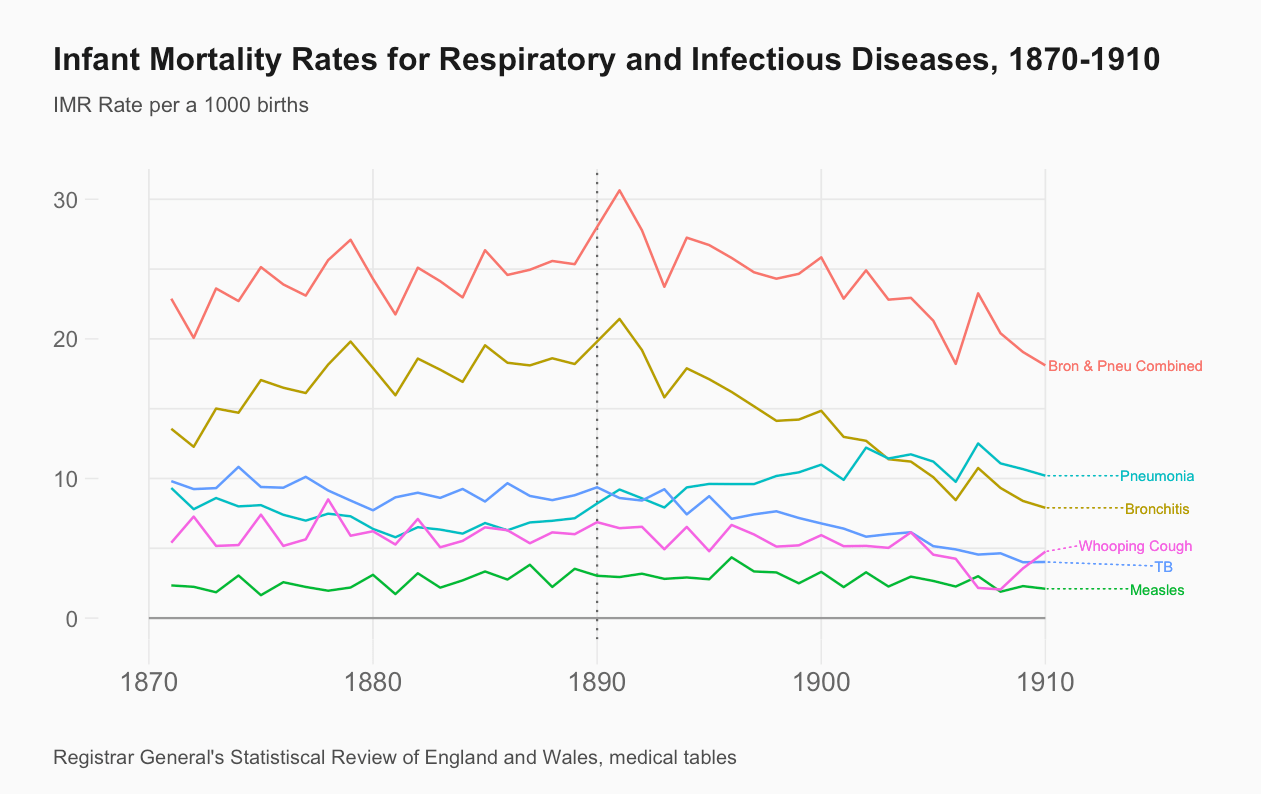
Bronchitis, an inflammation of the lungs characterised by the excessive production of mucus, commonly associated with the Industrial Revolution and the effects of burning coal, had reached peak levels in the general population in 1879. Soot particles in the air would combine with water vapour causing the infamous smog — more commonly known as 'Peasoupers' — amplified by cold wet weather, which would envelop cities and the surrounding areas — a perfect cauldron for bronchitis. However, for the period in question, mortality rates from the disease were in decline.14 Pneumonia, with very similar symptoms to bronchitis, was again commonly associated with the Industrial Revolution — but its cause is bacterial and associated with poor living conditions compounded by poor nutrition — incidents of pneumonia would continue to rise throughout, and beyond, the period in question.15
In terms of infant mortality (Figure 4), it is not until 1890 that the drop in bronchitis in the general population begins to be reflected in the IMR figures. The rising rates in pneumonia could be attributed to the increase of births taking place in urban areas, increasing the likelihood of their exposure to such infections, but it is also important to note that there was a change in how these disease were categorised — pneumonia was once listed alongside bronchitis (1870) as 'diseases of the lungs', but would later be classified under infectious diseases, making the process of establishing an accurate picture difficult.16 However, if the IMR rates from both diseases are combined, then overall there is a small decrease — in 1870 they were responsible for 22.88 per thousand deaths and in 1910, down to 18.1 per thousand deaths.17
Infectious diseases
Tuberculosis (TB), a bacterial disease that also affects the lungs, had, in the early part of the nineteenth century, reached epidemic levels across Europe and the US, and was responsible for one in four deaths in the UK alone. TB is extremely contagious, spreading easily through coughs and sneezes, and compounded by the movements of the Industrial Revolution and cramped working and living conditions. However, from the middle of the nineteenth century, the mortality rate of TB would begin to decline, the reason — a simple one — was that the bacteria had become less virulent. This was further accelerated when, in 1860, physician William Budd (1811-1880), made the connection that diseases such as TB and scarlet fever could be spread through personal transmission — until this point TB was thought to be a hereditary disease, hence its other name, consumption, and it was not until 1882 that the German physician, Nobel Prize winner and 'Father of microbiology', Robert Koch (1843-1910) identified the bacteria behind TB.18 TB has been in continual decline ever since (with two interruptions, both caused by the World Wars) and today, in England, it accounts for just 7.3 per hundred thousand deaths.19
Turning to the IMR, one of the groups to benefit most from the falling TB rates were women aged between 20-40 who saw the biggest decline in mortality rates associated with TB.20 This improvement in the mother's health, in turn, can be seen in the dramatic drop of infant deaths caused by TB; from 9.81 per thousand in 1870 to just 4.02 in 1910 (Figure 4).
Other infectious diseases such as smallpox, scarlet fever, and diphtheria also declined during this period; the drop in deaths from smallpox can be attributed to successful vaccination programmes which all but eliminated the disease.21 A slightly more complicated pattern, though it did drop overall, applies to whooping cough. Measles, on the other hand, saw a complicated pattern — and may form part of a future article in this series covering epidemics — and was increased for most of the period, but not enough to sway the overall headline.22 As a whole, the aforementioned diseases in this section accounted for 20 percent of infant deaths, and had fallen from 23.1 per thousand in 1870 to just 11.2 per thousand in 1910.23
Atrophy, Convulsions, and Premature Deaths
Forty percent of the deaths in this period were down to atrophy, convulsions, and premature deaths, and this is where the analysis starts to go grey. Atrophy had a loose definition — along the lines of 'failed to survive' — and when looking at deaths where this is recorded, there are a couple of considerations to keep in mind: it was something that was felt to be out of the practitioners' control and practitioners could be quite 'fluid' in how they registered deaths; referring back to earlier comments in this series, we do know doctors and midwifes were not free from criticism and took steps to protect their reputations, but on the flipside, a doctor was also likely to record the cause as atrophy on a death certificate 'to avoid adding to the grief of the mother and father by putting syphilis as the primary cause of the death'. 24
Similarly, convulsions, or convulsive fits, were recorded as 'diseases of the brain' and were normally the 'final symptom' of an underlying condition; however, the underlying condition was rarely recorded or known, thus leaving something of a black hole in terms of understanding.25 The decline in these conditions is most likely down to a better understanding and treatment of what those underlying conditions were and are an indicator of improvements in the health of the nation.
On paper, premature deaths would increase during this period, but this is more likely due to better recordkeeping practices than a reflection of neonatal health.26 Nevertheless, taking all three factors into account, infant mortality rates dropped from 66 per thousand deaths in 1870 to 42 in 1910.27
Other Factors
Another main driver was the fall in the birth rate (number of births per thousand females aged 15-45 years) between 1871 and 1911, from 152.2 to just 98.0.28 On the face of it, it seems a simple equation that fewer pregnancies equals fewer births and therefore a lower IMR, but interestingly the relationship was circular. A lower IMR meant a lengthening between births and, therefore, a healthier mother — especially when it came to breast feeding — and more time for infant care, which in turn meant more chance of infant survival. However, the situation is not that black and white as Robert Woods postulated, in a co-authored paper in 1995, that while declines in the birth rate go some of the way to explaining the decline in IMR, there are other factors to consider.29 In his conclusion, he put forward three further points, which were further built on in his 2000 book The Demography of Victorian England and Wales.30
In full, he ascribed the fall of infant mortality to the following broad reasons:
-
The decline of fertility, both marital and illegitimate, from the 1870s and certainly from the 1890s served to reduce the level of infant mortality both by affecting the number of pregnancies a woman might experience and by increasing the intervals between successive births.
-
Long-term improvements in levels of female education helped not only to increase the likelihood that family limitation would be attempted, but also to improve the status of women, their access to written information, the way in which they cared for their children and the way in which they cared for themselves. They may even have encouraged more women to breastfeed.
-
The 'health of towns' movement did make significant advances possible, most of which bore fruit during the late nineteenth century or early twentieth century when the availability of uncontaminated water was transformed by schemes for water carriage and purification.
-
The improvement in milk supply and food quality, the availability of more highly qualified midwives, the institution of ante-natal care and the extension of the post-natal health visitor service were all of special significance, particularly the last mentioned, but usually they served to reinforce an existing trend by focusing medical and health service attention on those mothers and children most at risk in areas with the highest childhood mortality rates.31
In regards to points 1 and 2, just to give an indication of the complexity of this topic, the book devotes over 60 pages alone to the subject of why, socially, economically and demographically — and how — the effect family limitation would have on the fertility rate, pointing out that there are still contradictions in the data.32 As our cohort experienced the changes from point 2 to 4 directly, they will be the basis of future articles, but to summarise for now: from 1870, infant mortality was in decline, mainly due to a reduction in infectious diseases, a decline in the fertility rate, improvements in the health of the mother, better education, and improvements in institutional support, however, there is one further layer of complexity that needs to be discussed before moving on.
Regional Differences
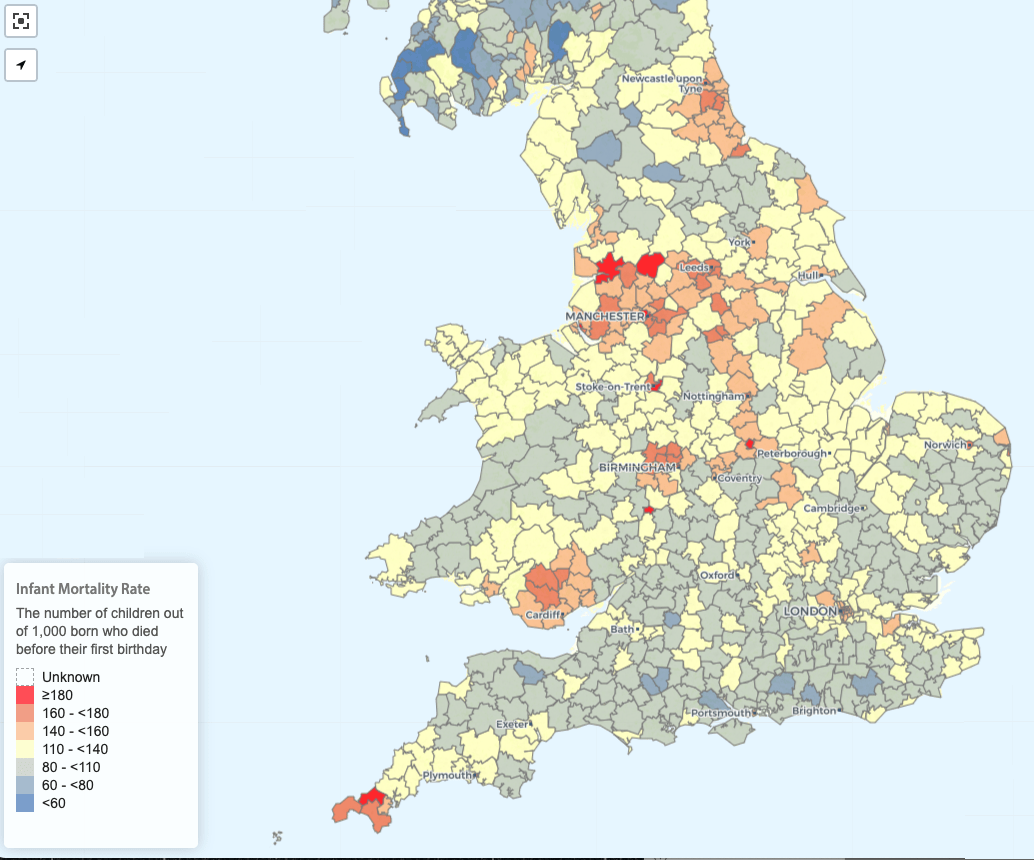
Statistically speaking, if the birth was legitimate, from a member of the upper-classes, and they lived in the countryside, then the survival rate was much higher than an illegitimate birth from a member of the lower classes in an industrial area. While overall there is a clear distinction between the IMR in rural and urban areas (the rate being 4 per thousand in rural and 20 per thousand in urban areas for the period) there is no geographical uniformity — rather they are grouped in clusters, with the Northwest of England and South Wales being behind the rates in the East of England.33 As discussed in the summary in part 3 on maternal mortality, where you lived represented a roll of the dice. Going further, Woods hypothesised that if a woman had the choice (within the constraints of the nineteenth century) of moving through time or space, in regards to giving birth, then the far better option would be to move through space.34 There is a map of regional IMR rates (from which figure 5 is drawn), along with other data, which you can explore in more detail here.
An important consideration in this regard, which applies to all matters of health, is that change was both slow and inconsistent. In the numbers section above, the roll out of the MOH was mentioned, and while it took time, it was one the key forces, along with the 'Health of Towns' movement, in driving down the factors associated with high IMR Rates, as well as improving the overall health of those in areas they were employed.
Despite the regional differences, the headline remains that the IMR rate, from 1870, was in decline. Despite all the progress that had been made, the rate would dramatically shoot back up in the 1890s.
The Anomaly
The Cause
The latter period of the nineteenth century was marked by hot dry summers and unusual rainfall patterns across Europe. Countries including Sweden, Switzerland, and France (with a similar IMR Pattern to England and Wales) would all, as a result, see a dramatic increase in their IMR rates during this period.35
It was not uncommon to find newspaper stories like the below; this snippet taken from the Liverpool Health Committee:
The infant mortality rate, in the space of a week, had jumped from to 177 to 340, some 163 higher than the previous week and 73 above the 10-year average. Diarrhoea was believed to be the main reason, due to unusual weather causing food to ferment and of 463 deaths, only 23 were from children fed from breast alone, the others being on a diet of wholly or partially artificial diet.36
Work from a number of academics has shown that the increase in infant mortality rates was down to the growth in gastronomical diseases caused by the unusual weather patterns, and, if figures for deaths caused by such diseases are excluded from the data, then the backwards 'N' disappears entirely from the chart (Figure 3) leaving a clear downward trend from 1870.37 Which leads to the question: why was the change in weather so deadly?
The intense, fatal, and widespread effects of gastronomical diseases have been linked to the following — all of which are factors that were amplified by the weather:
- Water supply
- The sewage system
- The surge in horse transport
- Urbanisation
- Population density
However, there are contradictions: major investment in water and sanitation across towns had been ongoing since 1870, and other water-dependant diseases, such as cholera and typhoid, were down for the period.38
Nigel Morgan highlighted the surge in horse transport, noting an 1880 study of the town of Preston with 11,000 dwellings — a town of five square miles, and 600 horses. If each horse produced 5 tonnes of manure a year, that meant a total of 3,000 tons or 600 tons per square mile — an ideal environment for the housefly (a carrier of such diseases) to flourish, especially in the hot sun. However, Morgan points out that the relationship is imperfect, as an increase in horse transport was also an indicator of rising living standards, plus the period saw an increase in the rise of suburbanisation (another fascinating topic which will be covered in this series) and other forms of urban transport.39
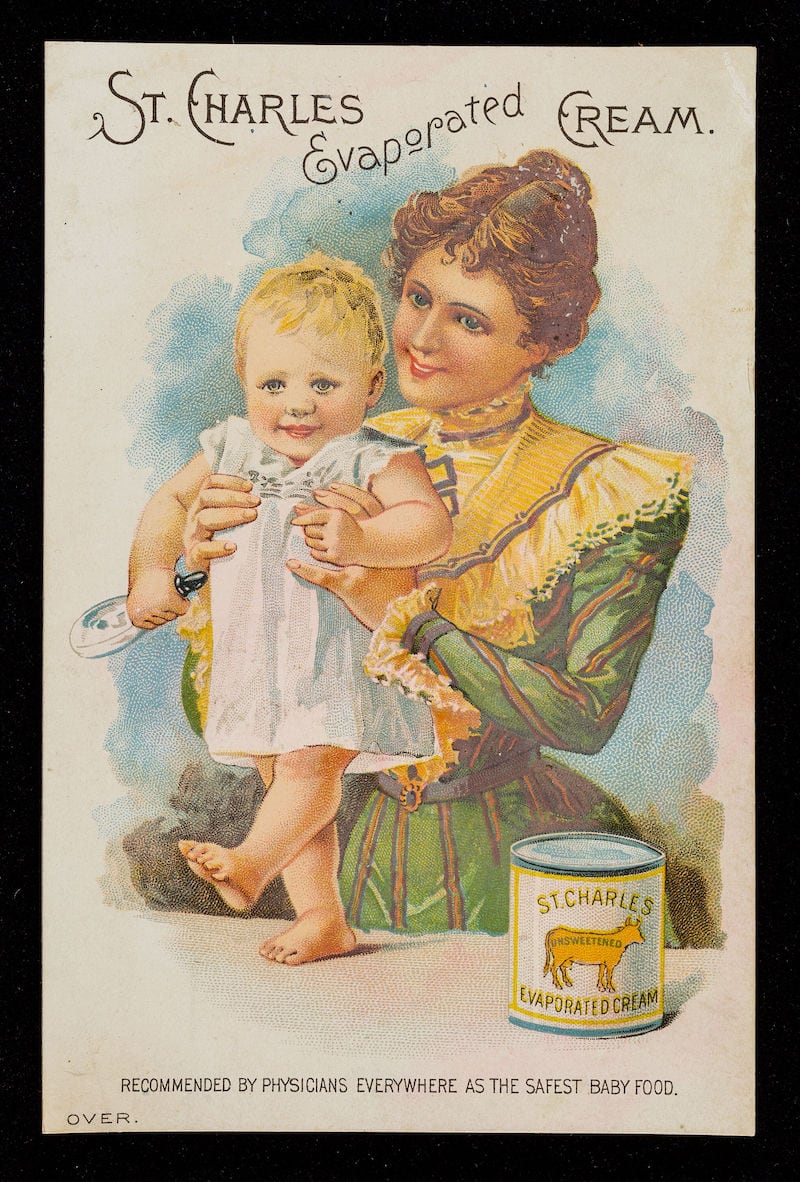
Robert Millar and France Bell have argued that 'focusing on environmental factors alone obscures, or acts as a proxy for the real mechanisms involved'.40 They examined, among other factors, the domestic setting — the size of the house and specifically access to water closets; women's occupations — noting the higher neo-natal mortality rates in women involved in work such as weaving in the North, and curiously, among women typists in Kensington, London. They also considered other factors such as municipal spending on services such as street cleaning, and the rise in manufactured baby food. For the regions of Rhondda, Poplar, Stoke, Finsbury, and Kensington, for example, among those infants who were not breast fed, the mortality rate was five times higher from diarrhoea and four times higher from other causes.41 Artificial food was popular with the rising so-called middle class; however, there were risks with the source, transportation and storage of such foods — but again, problems with food transport and storage were universal.42
While there may be contradictions, all of the factors mentioned above gave rise to the levels of mortality seen — a perfect storm, and in fairness, none of the authors in the articles cited above are saying it was down to just one thing, as Linda Margaret Davies said in her 2007 PhD, 'While there is broad agreement between both cotemporary and modern commentators on the factors, there is wide divergence of opinion to what were the greatest factors were'.43 One thing is clear: the change in climate had a cataclysmic effect on the progress which had been made, a reminder that no matter how good we think we are, we are always at the mercy of nature.
Determinants
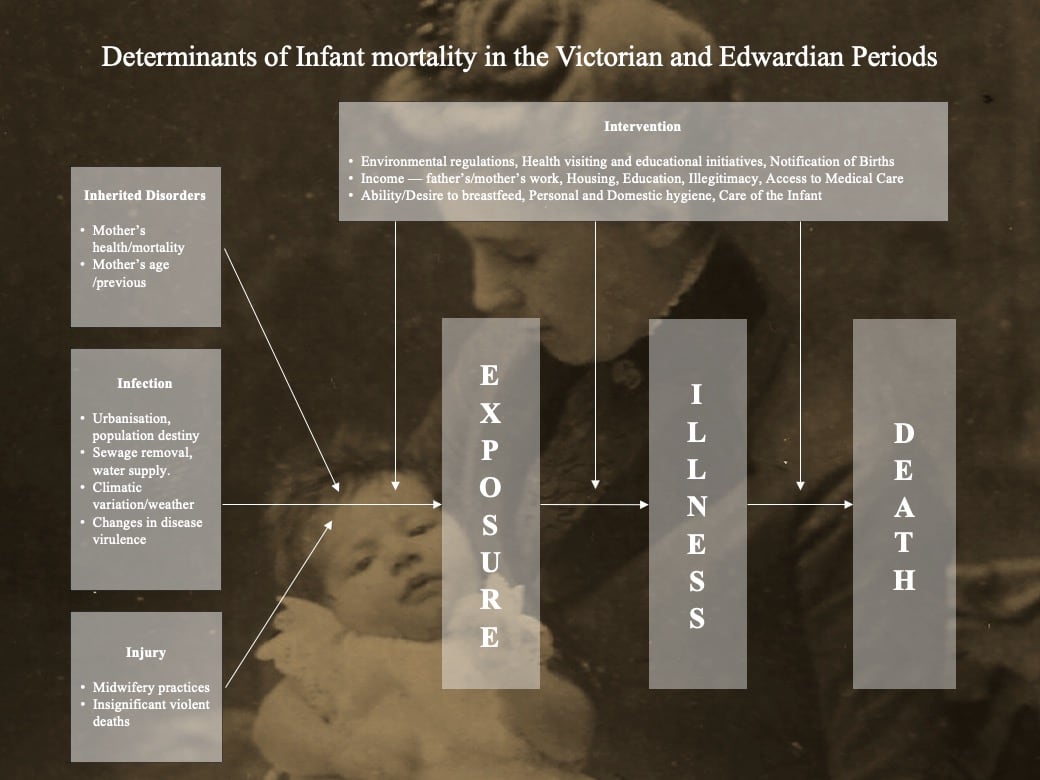
Before moving on to the summary, there is one further point I would like to make. As mentioned in the introduction, this is a complicated topic, and from researching it, I found myself, at times, going round in circles — I was guilty of trying to focus too much on individual factors, rather than looking at them as a whole. I have recreated Figure 7 from Chris Galley's open access book that looks at the subject in far more detail (covering 1538 to 2000), and which I can highly recommend — it can be found here The topic becomes a lot clearer when you view it through the above lens, and while we have spoken about factors and forces, the single most important consideration is the mother, both her health, and as Galley has commented ,'even in the harshest of conditions, good effective parenting can mitigate the worst socio-economic circumstances'.44
Summary
The years between 1870 and 1910 are a period which, overall, saw great progress being made in reducing the IMR, as a result of the fall in infectious diseases, improvements in maternal health, better education, and institutional support as well as falls in the fertility rate. This was, however, thwarted by unusual weather patterns, which bought with them an increase in gastronomical diseases in the last part of the nineteenth century. However, the decline would resume at the start of the nineteenth century and would continue to fall throughout the twentieth century.
In terms of our cohort, given that they were born at the cusp in the rise of IMR, statistically they were more likely to have an older sibling, and if they had a younger sibling, then the age difference between them and their older siblings would be greater. I am reminded of a description, from Kathlyn Dayus' biography (highly recommended reading) of her living room; on the walls below prints which represented 'Faith, Hope and Charity' along with a print of 'Bubbles' from the Pear soaps adverts, was a row of photographs of 'Mums' first-, second- and third-born, all of whom were deceased, followed by death cards and birth certificates for the others, along with the occasional paper motto expressing sentiments such as 'God Bless This House'.45
From this point onwards, our cohort's life expectancy increases, having shrunk by 160,000 due to infant mortality; between now and our cohort being aged five, it will only shrink a further 54,000, and then a further 6,000 by the time they turn ten, with our cohort benefiting immensely from the improvements in public health that came with the turn of the century.46
Returning to Jay Winters' comments at the opening of this article, I want to highlight that for a long time there has been an 'Ivory-Tower-Doff-Cap-View' on the working-class in the First World War which arguably became the popularised view, due to the former Historian Arthur Marwick, and his work in the 1960s.47 Winters' book is a terrible continuation of such views, and while health is a crucial part of the First World War narrative, the suggestion that the war improved, in this instance, the infant mortality rate is just nonsense. Woods destroys Winters' entire argument in a footnote stating that it is irrelevant.48 The rest of his conclusions about the 'benefits of war' should be treated with equal caution, and while the book is over 35 years old, it is still cited frequently, and this ivory tower view is still present in our current analysis and understanding of the war — on my recent MA course, in a discussion around morale, an argument from a 2016 book was put forward, that the reason why men put up with the conditions in the trenches was because it was better than their working-class environment — which, as an assumption and a generalisation again proves to be complete nonsense, as these series of articles will continue to unravel.49
The next two articles in this series will be more light-hearted in nature; the first will look an 1899 birth — which among other things, will consider some of the regional superstitions and beliefs of the time (which seem to involve a lot of cake). The second will introduce another major part of the overall narrative which is how society was more focused locally. To do this, we will be taking a look at the local newspapers from 5th August 1899 to see what sort of (local) world our cohort was about to enter.
-
J. Winter, The Great War and the British People (London: Macmillan, 1987[1986]), p.141. ↩︎
-
J. Winter, The Great War and the British People, p.153. ↩︎
-
J. Winter, The Great War and the British People, p.240. ↩︎
-
R. Millward & F. Bell, 'Infant Mortality in Victorian Britain: The Mother as Medium', The Economic History Review, 54(4) (2001), p.705. ↩︎
-
C. Galley, 'Infant mortality in England, 1538-2000: Stability and the Beginnings of Change, 1837-1910*, Local Population studies, 103 (2019), pp.101-103. ↩︎
-
J.A. Bergin, 'Birth and death in nineteenth-century Dublin's lying-in hospitals' in Farrell (ed.), She said she was in the family way (London: University of London Press: Institute of Historical Research, 2012), pp.107-.108; Report of the Medical Officer of Health to the Gloucester Urban Sanitary Authority for 1889 presented to the Sanitary committee of that body at the Meeting held on 21^st^ March 1890, John Bellows, Gloucester. ↩︎
-
C. Galley, 'Infant mortality in England 1837-1910', p.99. ↩︎
-
P. Kane, Victorian Families in Fact and Fiction (New York: St Martin's Press, 1997[1995]), p.125. ↩︎
-
The Mansfield Reporter, Friday 14 September 1888; Sheffield Weekly Telegraph, Saturday 28 February 1885. ↩︎
-
A. Engineer, 'The Society of Medical Officers of Health: It's History and its Archive', Medical History, (45) (2001), p.100. ↩︎
-
Office for National Statistics, 'Child and infant mortality in England and Wales: 2022' ↩︎
-
J.H. Widdicome, 'A Brief History of Bronchitis in England and Wales', Journal of the COPD Foundation, 7(4) (2020), pp.306-307. ↩︎
-
P. Sharpe, 'Explaining the short stature of the poor: chronic childhood disease and growth in nineteenth century England', The Economic History Review, 65(4) (2012), pp.1470-1480. ↩︎
-
C. Galley, 'Infant mortality in England 1837-1910', p.127. ↩︎
-
Registrar General's Statistic Review of England and Wales. ↩︎
-
M.S. Dunhill, 'Commentary: William Budd on cholera, International Journal of Epidemiology', 42(6) (2013), pp.1567-1577. ↩︎
-
P. Glaziou, K. Floyd, M. Raviglione, 'Trends in tuberculosis in the UK', Thorax, 73(8) (2018), pp-702-703; UK Health Security Agency, Tuberculosis in England 2021 Report (London: UH Health Security Agency), p.4. ↩︎
-
C. Galley, 'Infant mortality in England 1837-1910', p.130; footnote 67. ↩︎
-
C. Galley, 'Infant mortality in England 1837-1910', p.130. ↩︎
-
C. Galley, 'Infant mortality in England 1837-1910', pp. 129-130. ↩︎
-
C. Galley, 'Infant mortality in England 1837-1910', p.130. ↩︎
-
C. Galley, 'Infant mortality in England 1837-1910', pp.130-131; Armand Routh quoted in C. Galley, 'Infant mortality in England, 1538:2000: Stability and the Beginnings of Change, 1837-1910*, Local Population studies, 103 (2019), p.132. ↩︎
-
C. Galley, 'Infant mortality in England 1837-1910', p.166. ↩︎
-
R. Woods, The Demography of Victorian England and Wales (Cambridge: Cambridge University Press, 2000), pp.274-277. ↩︎
-
Approximate being used, as having to read off the values from a chart from the General Register. ↩︎
-
S. Pooley, 'Parenthood, Child-rearing and fertility in England, 1850,1914', The history of the Family, 18(1) (2013), p.87. ↩︎
-
R. Woods& P.A. Paterson, 'The Causes of Rapid Infant Mortality Decline in England and Wales, 1861-1921 Part 2', Population Studies, Vol 43(1) (1989), pp.115-126. ↩︎
-
R. Woods, The Demography of Victorian England and Wales (Cambridge: Cambridge University Press, 2000). ↩︎
-
R. Woods, The Demography of Victorian England and Wales, pp.305-306. ↩︎
-
R. Woods, The Demography of Victorian England and Wales, pp.110-169. ↩︎
-
P. Atkinson, B. Francis, I. Gregory & C. Porter, 'Patterns of Infant Mortality in rural England and Wales, 1850-1910', Economic History Review, pp.40-41. ↩︎
-
R. Woods, The Demography of Victorian England and Wales, pp.310. ↩︎
-
R. Woods & P.A. Paterson, 'The Cause of Rapid Infant Mortality Decline in England and Wales, 1861-1821 Part I', Population Studies, Vol 42(3) (1988), p.350. ↩︎
-
Denton and Haughton Examiner, Saturday 03 August 1889. ↩︎
-
R. Millward & F. Bell, 'Infant Mortality in Victorian Britain: The Mother as Medium', The Economic History Review, 54(4) (2001), p.699. ↩︎
-
R. Davenport, 'Patterns of Death' in Stearns(ed.), The Routledge History of Death Since 1800 (Taylor & Francis, 2021), pp.34-35. ↩︎
-
N. Morgan, 'Infant Mortality, Flies and Horses in Later-Nineteenth-Century Towns: A Case Study of Preston', Continuity and Change, 17 (1) (2002), p.116, pp.125-126. ↩︎
-
B. Burström & Lisa Öberg, 'The Dialectics of Childhood Diarrhoea Mortality', International Journal of Health Services, 36(3) (2006),pp-484-487; R. Millward & F. Bell, 'Infant Mortality in Victorian Britain', p.705. ↩︎
-
R. Millward & F. Bell, 'Infant Mortality in Victorian Britain', pp.707-711. ↩︎
-
R. Millward & F. Bell, 'Infant Mortality in Victorian Britain', pp.711-712. ↩︎
-
Linda Margaret Davies, 'The Conquest of Infant Mortality: the case of Hemsworth, 1871-1911', (PhD, Open University, 2007) p.175. ↩︎
-
R. Millward & F. Bell, 'Infant Mortality in Victorian Britain', pp.272-728; C. Galley, 'Infant mortality in England 1837-1910', p.188. ↩︎
-
K. Dayus, Her People: The Moving Story of a Working-Class Birmingham Childhood (London: Virago Press, 1982), pp. 76-78. ↩︎
-
Estimates — see Part 1 for overall size of Cohort. Then, less 1 in 7(169,500) to account for IMR and then 0.6 (53,000) Early childhood rate for between 1890-1895 applied. A more detailed breakdown on the estimates and actuals will be coming later in this series. ↩︎
-
A. Marwick, The Deluge: British Society and the First World War (London: Norton library 1965) ↩︎
-
R. Woods, The Demography of Victorian England and Wales, p.300, footnote 93. ↩︎
-
P. Hodgkinson, Glum Heroes: Hardship, Fear and Death — Resilience and Coping in the British Army on the Western Front 1914-1918 (Solihull: Helion Press, 2016) ↩︎
Posts in this series
- AYIT Part 4: An overview of Infant Mortality in England and Wales: 1870-1910
- AYIT Part 3: Maternal Mortality in the Late Victorian and Early Edwardian period
- AYIT Part 2: A Brief Overview of the state of Midwifery in the 1800s
- AYIT Appendix 1.1: Voluntary Maternity Hospitals 1860-1930
- Are YOU in this ? Bibliography
- Are YOU in this ? Part 1: An Introduction